|
a. To graph the parabola, enter
the equation into y =.
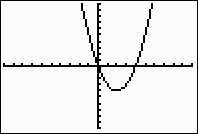
The graph can be seen by using a standard 10 x 10 window
(Zoom 6), but this question
specifies the interval [-1, 5].
Standard 10 x10
window
 |
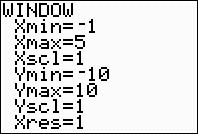
Setting WINDOW to
[-1, 5]
 |
Interval [-1, 5]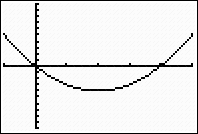 |
b. To find
the turning point, you are looking for the minimum (or
maximum) value of
the parabola. For this problem, we will
need the minimum option.
Graph the parabola. |
|
You may be tempted
to use the TRACE option to move to
the turning point, but be careful.
Used in this manner, the TRACE
option may only place you "close" to
the turning point and not at its
"exact" location. To be sure
you have the "exact" location, use
the minimum and maximum options. |
|
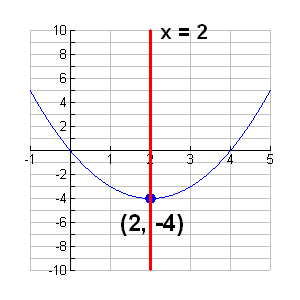
c. Once
you know the turning point, you know where the
line which is the axis of symmetry is located.
The axis of symmetry passes through the turning
point. For this example, the axis of
symmetry is x = 2. There is no need
to graph the axis of symmetry on the calculator. |
 |
d. To find
the roots, you need to find the points at which the
graph crosses the x-axis. Again, do not be
tempted to use the TRACE option as it may not give the "exact" locations. Use the ZERO command to find the roots.
Locate the zero command.
2nd TRACE
(CALC), #2 zero
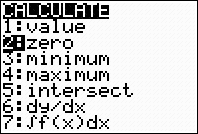 |
Left bound? Move the spider as close to the root (where the graph
crosses the x-axis) as possible. Now, hit the left
arrow again to move to the "left" of the root.
Hit
ENTER.
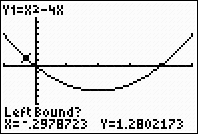 |
A "marker"
(anchor) ► will be set to the
left of the root.
Right bound? Move the
spider as close to the root (where the graph crosses the
x-axis) as possible. Now move to the "right" of the root. Hit ENTER. 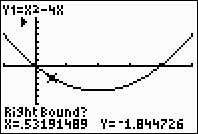 |
A "marker" (anchor) ◄ will be set to the right of the root.
Guess? Just hit
ENTER.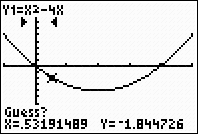 |
The coordinates of the zero
(the root) will appear.
Root at x = 0.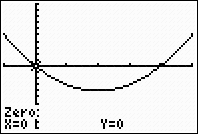 |
Repeat the entire process to find the second
root (which in this case happens to be
x = 4). |
|


![]()