Box-and-Whisker Plots
Box-and-Whisker Plots
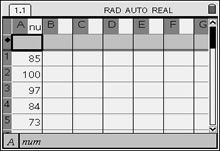
Given the data set
{85, 100, 97, 84, 73, 89, 73, 65, 50, 83, 79, 92, 78, 10},
create a box and whisker plot to represent this data.
There are two forms of box-and-whisker plots -- standard box-and-whisker and modified.
|
|||||||
1. Enter the data on a List & Spreadsheet Page. (See Lists and Spreadsheets for entering data.) |
|
||||||
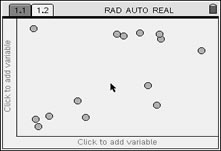
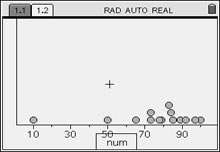
2. Create a Data & Statistics Page At first, a generic statistics graph will appear. |
|
||||||
3. Move the cursor to hover over the Click to add variable at the bottom of the screen. Click. Choose num from the choices.
|
 |
||||||
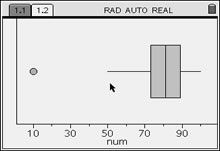
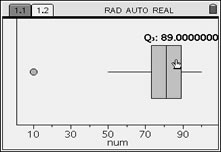
4. Press This is a modified box-and-whisker plot with the outlier separated from the rest of the data display. |
|
||||||
5. As you move the cursor to hover over the box-and-whisker plot, you will see the values for the minimum (not including outlier), first quartile, median, third quartile, and the maximum. If you move your cursor on the outlier and press Click, you will see its value. |
 |
||||||
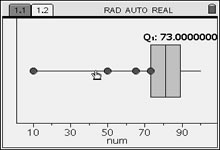
6. Creating a standard boxplot Press MENU, #2 Plot Properties, #3 Extend Box Plot Whiskers. |
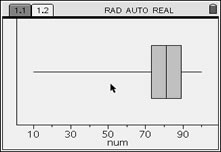 To return to the modified box plot, press MENU, #3 Show Box Plot Outliers. |
||||||
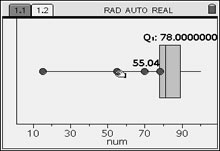
Show Points: Click on a box or whisker to display the points that make up that portion of the plot. |
|
||||||
Moving Points: If you grab and move any of the data points, the graph will change, the data information displayed for the graph will change and the list in the Lists & Spreadsheets will change. |
 |
||||||
![]()
Table of Contents | MathBits.com | Terms of Use